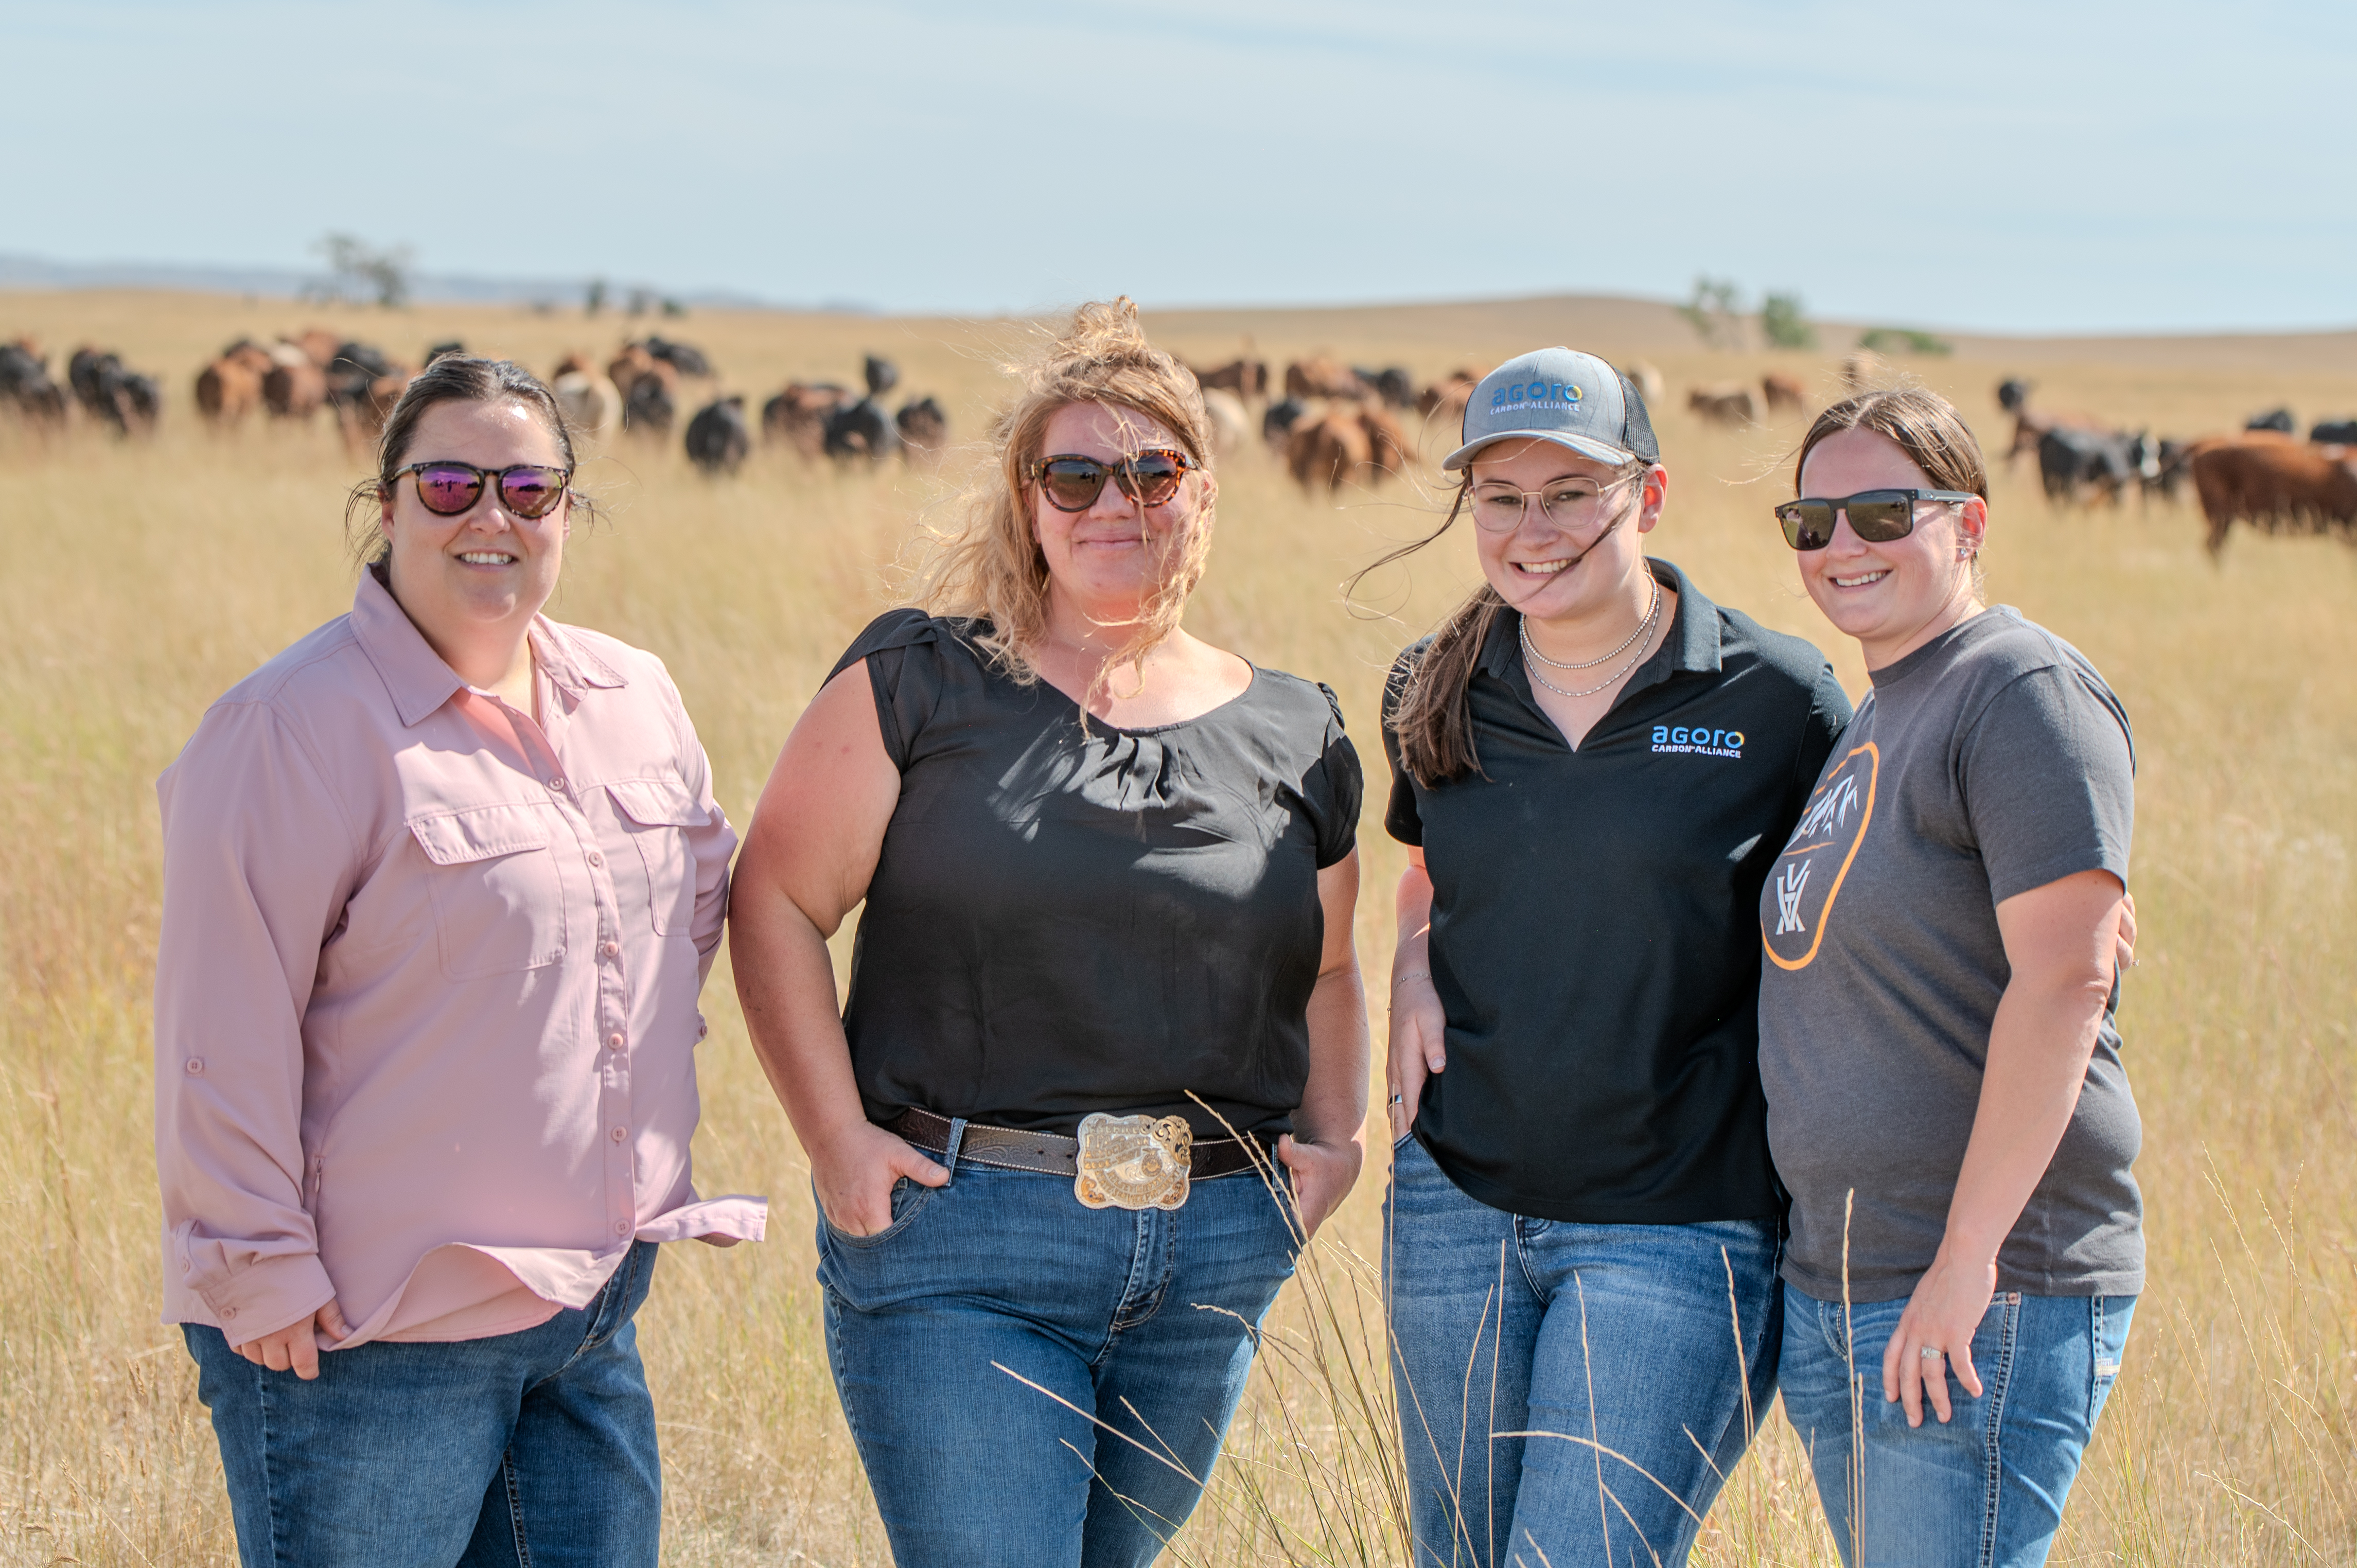
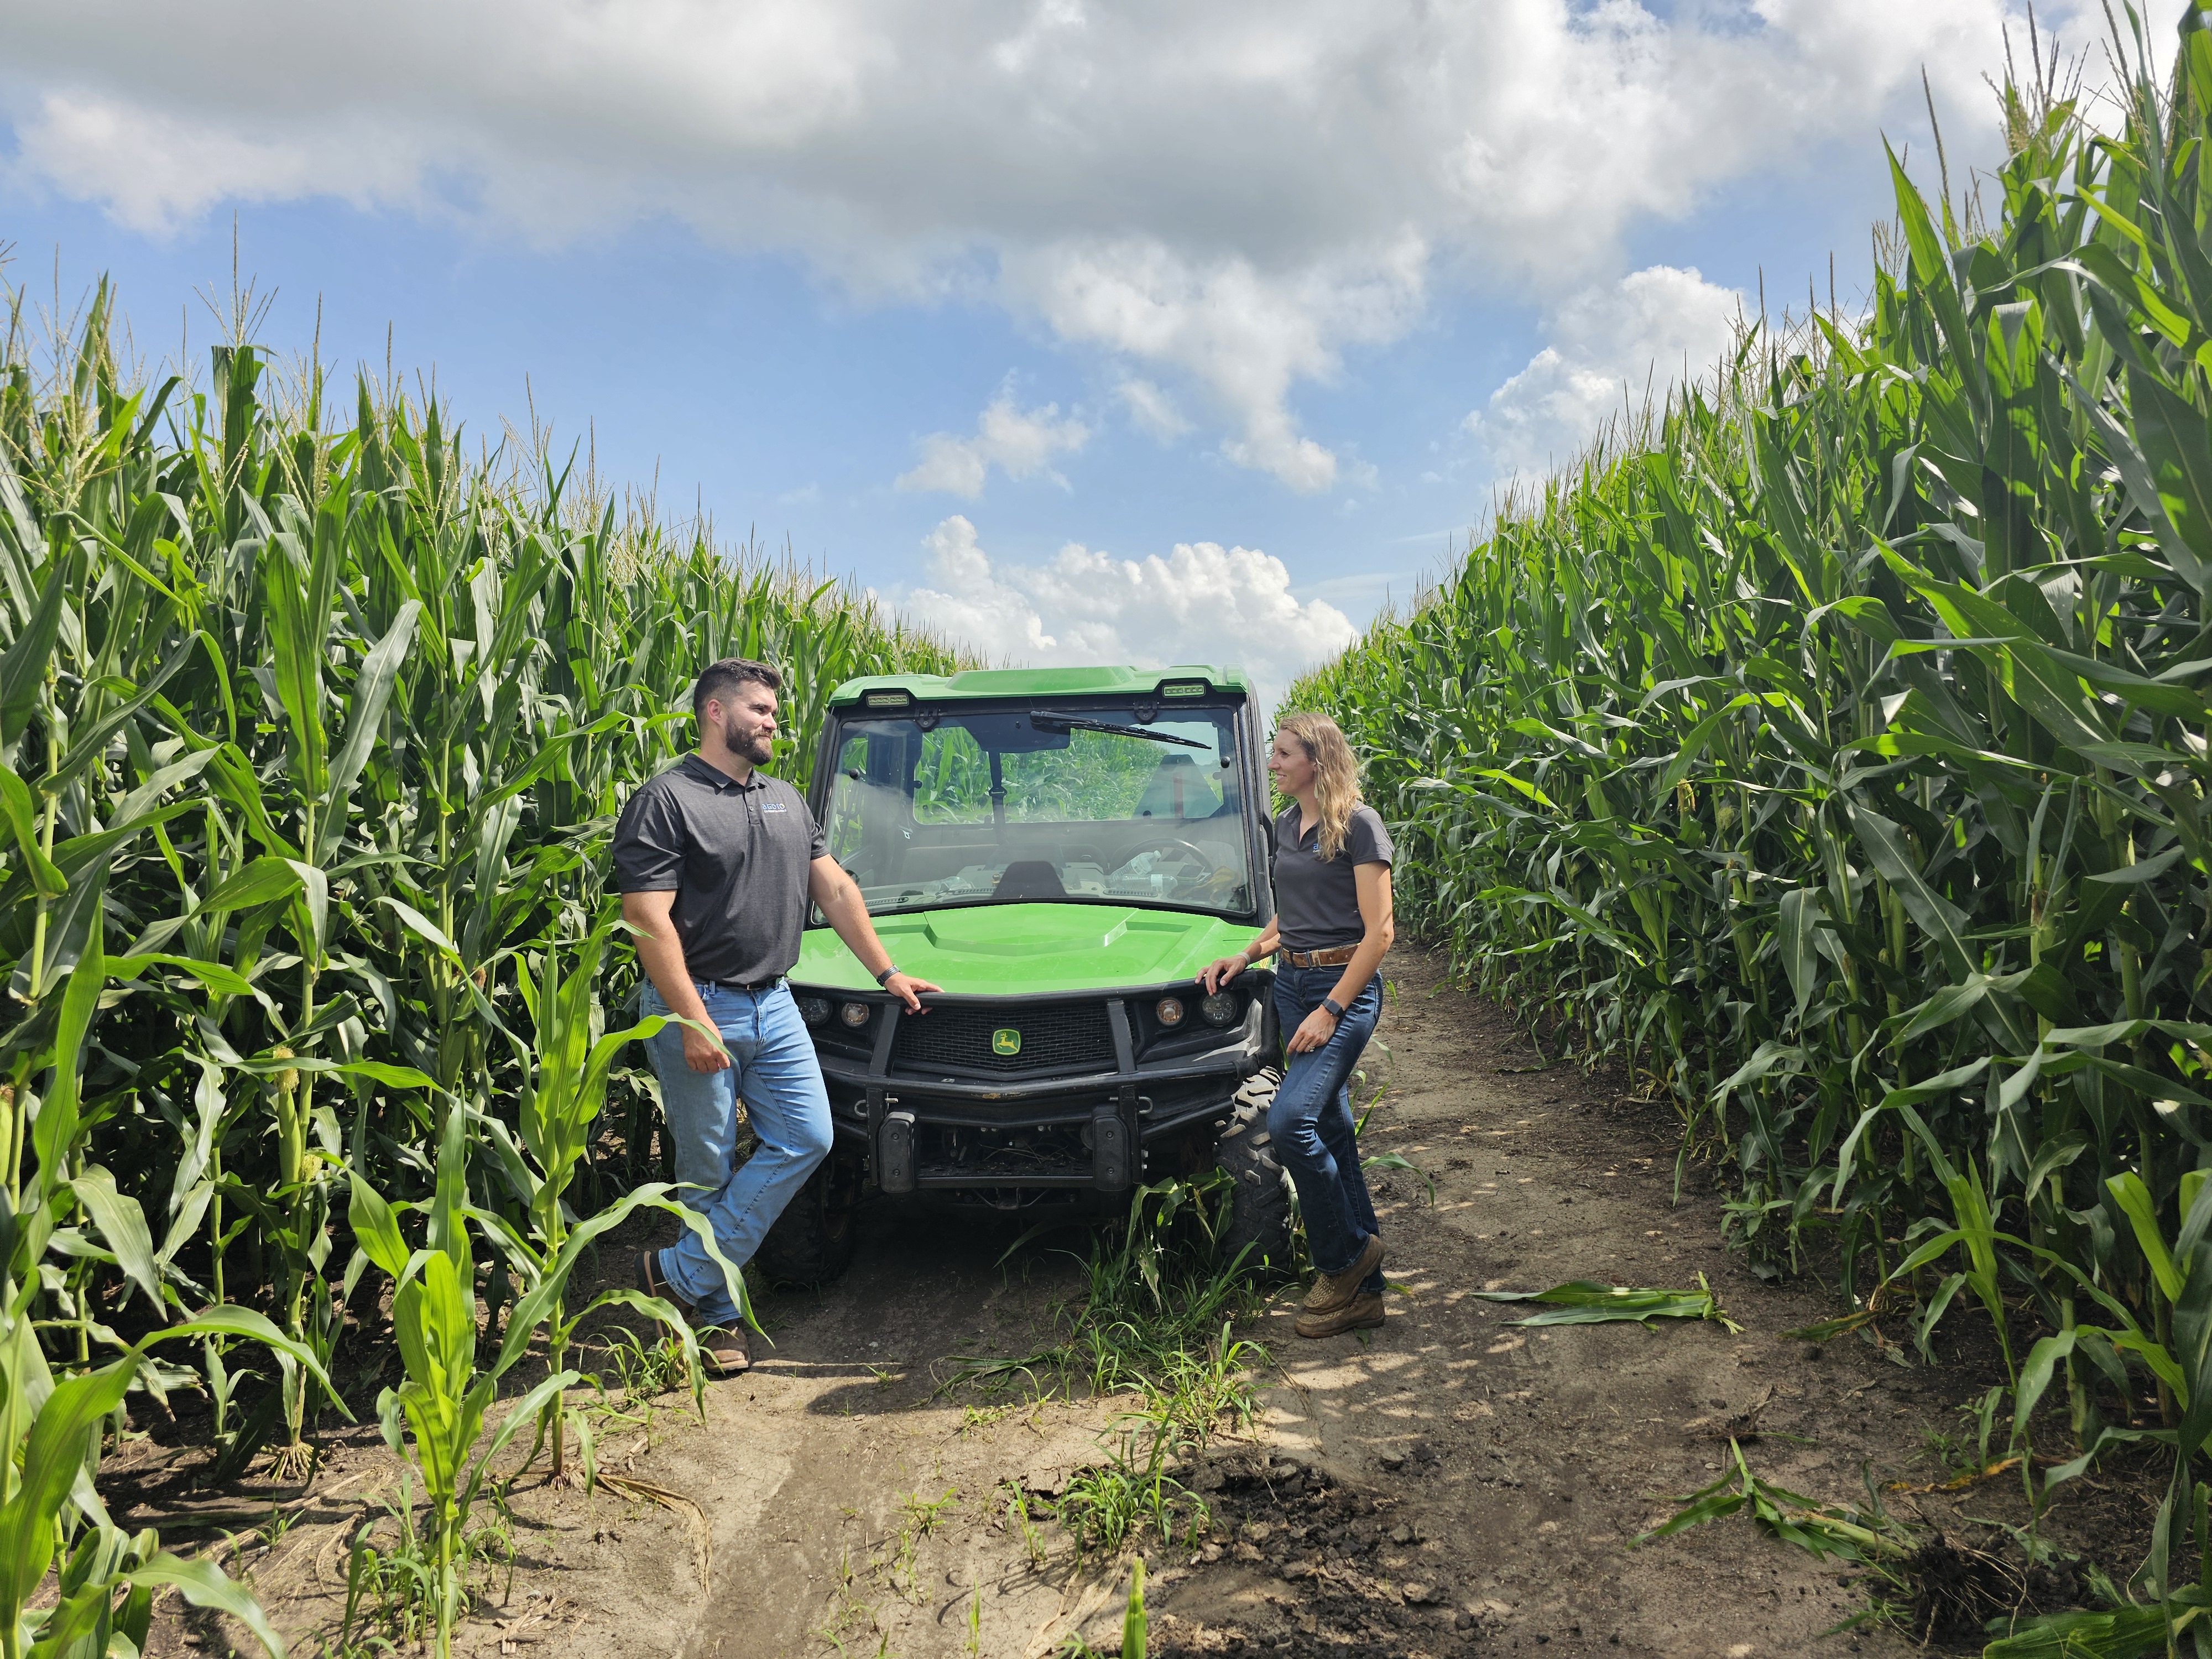
The prairie is a fascinating place when you stop and look at the intermingling of plants, animals, and geologic formations of all kinds. It makes me wonder how it has looked over the centuries of marching progress. Few landscapes remain mostly unbothered by civilization, some have been cultivated and transformed to further feed and clothe our growing nation, and more and more are undergoing extreme departures from open space towards urban development as our cities and towns overflow into the suburbs or beyond. What we do with the functioning ecosystems we have left will be something I think future generations will marvel at, for better or worse.
Death By Data
Part of the challenge of stewarding large landscapes, or even smaller acreages, is understanding the trends and influences of conditions and management over time. This is, to put it simply, called monitoring. Those of us who have worked to support land and natural resource managers have had the importance of monitoring pretty much beaten into us from the early years of our careers. We all know the importance of knowing the whole story of what has made our land into the system that it is today. So in an effort to tell that story, we have been collecting data, and collecting data, and collecting data! Then, unfortunately, a lot of that paperwork got filed away into a cabinet, never to see the light of day. Why would government agencies, universities, organizations, and industries not use this valuable information to inform management? Frankly, because it’s mostly junk, hard to understand, limited in scope, only applicable in similar contexts, and absolutely no fun to look at. Furthermore, it’s nearly useless when it comes to making decisions when you have a lot to make and can’t wait for a paper to be published before you delve into your next project.
I’m going to share a story from a friend, let’s call him Michael, well because that’s his name. So Michael is a roboticist by training and one of the brightest and most passionate people I know. One of the many innovative projects he was involved in tasked him with monitoring the microgreens and herbs growing in a specialty greenhouse. Being the kind of techy genius that he is, he set off to design a robust, top-of-the-line digital monitoring framework to measure every detail of the temperature, humidity, pH, and more – providing several decimal points of accuracy after each number. The impressive instrument display was probably a precision ag daydream. Then, his very practical farmer sister-in-law came to see how her fancy greenhouse setup was coming along, and her eyes immediately went sideways. She looked at him and said, I don’t want to look at any of this stuff, all I want to see is a red light, yellow light, or green light. And that’s when the figurative light went on for Michael. That’s what we all need to see to make decisions—something easy and simple that just tells us plainly that we are not running in the wrong direction. So that’s what I have set out to do in my work as a Support Agronomist: bring farmers and ranchers this kind of “red light/green light” monitoring data that is easy to collect, analyze, and share and doesn’t require a Ph.D. to understand.

Remembering Your Roots
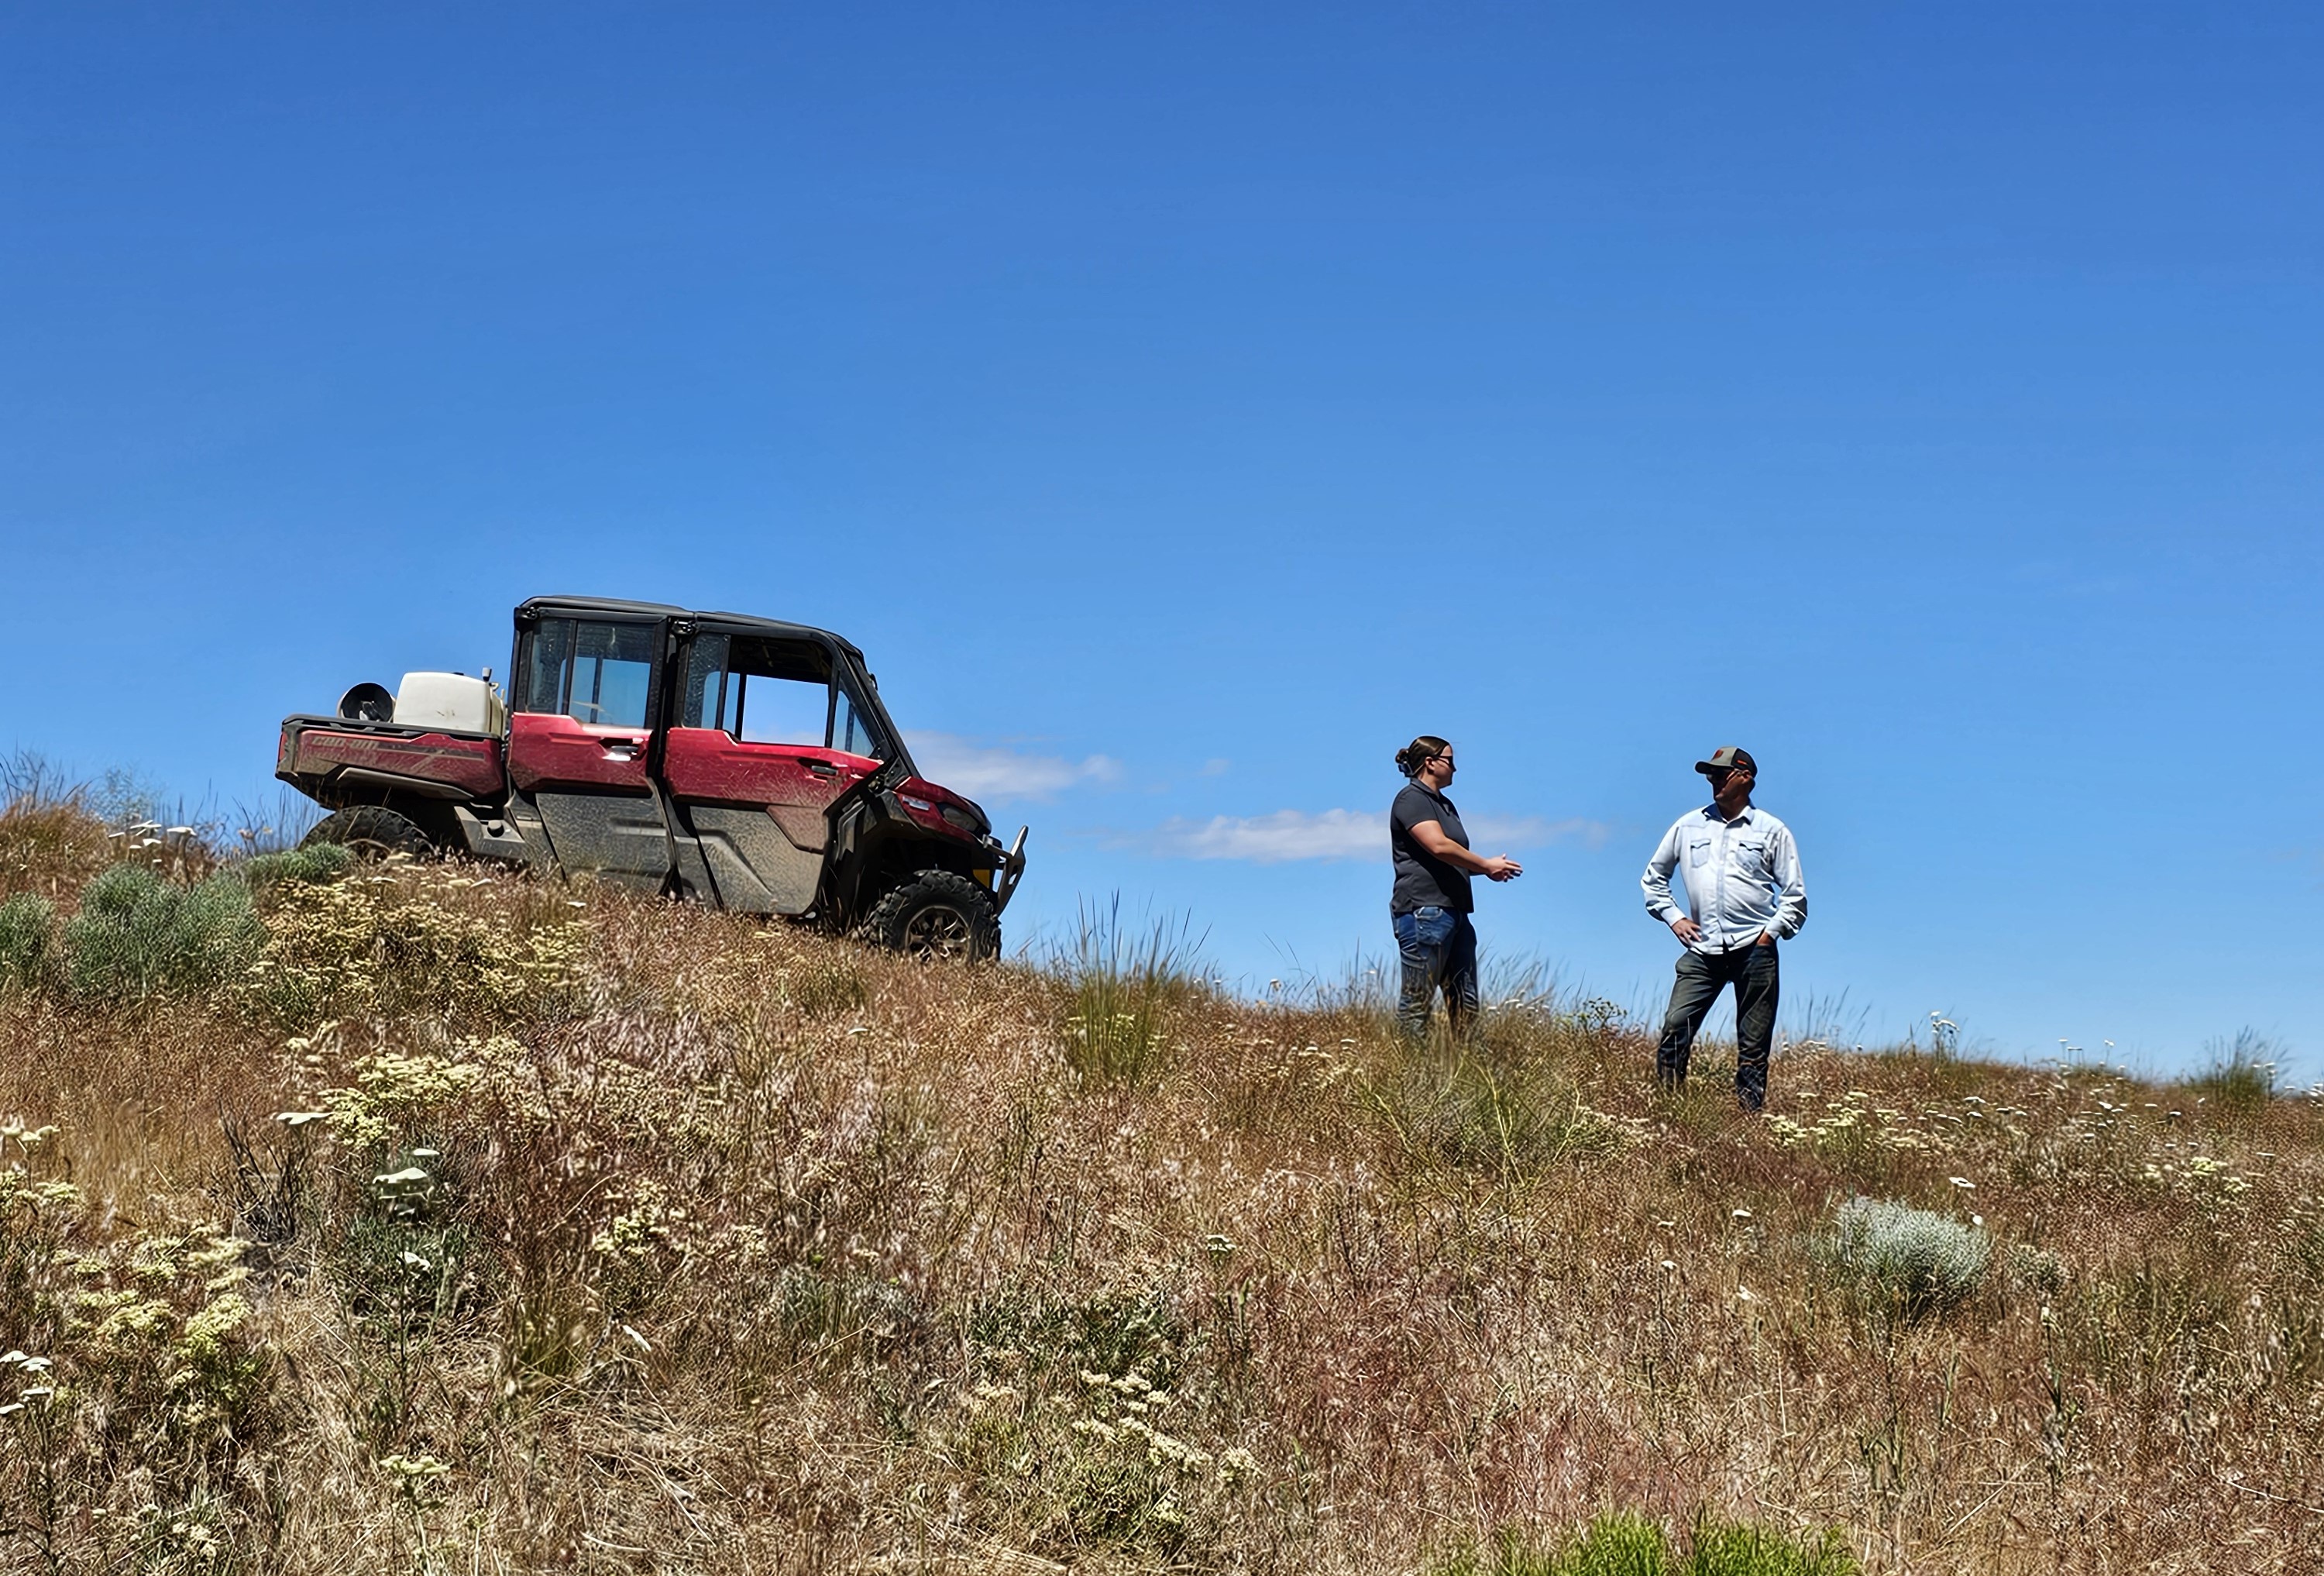
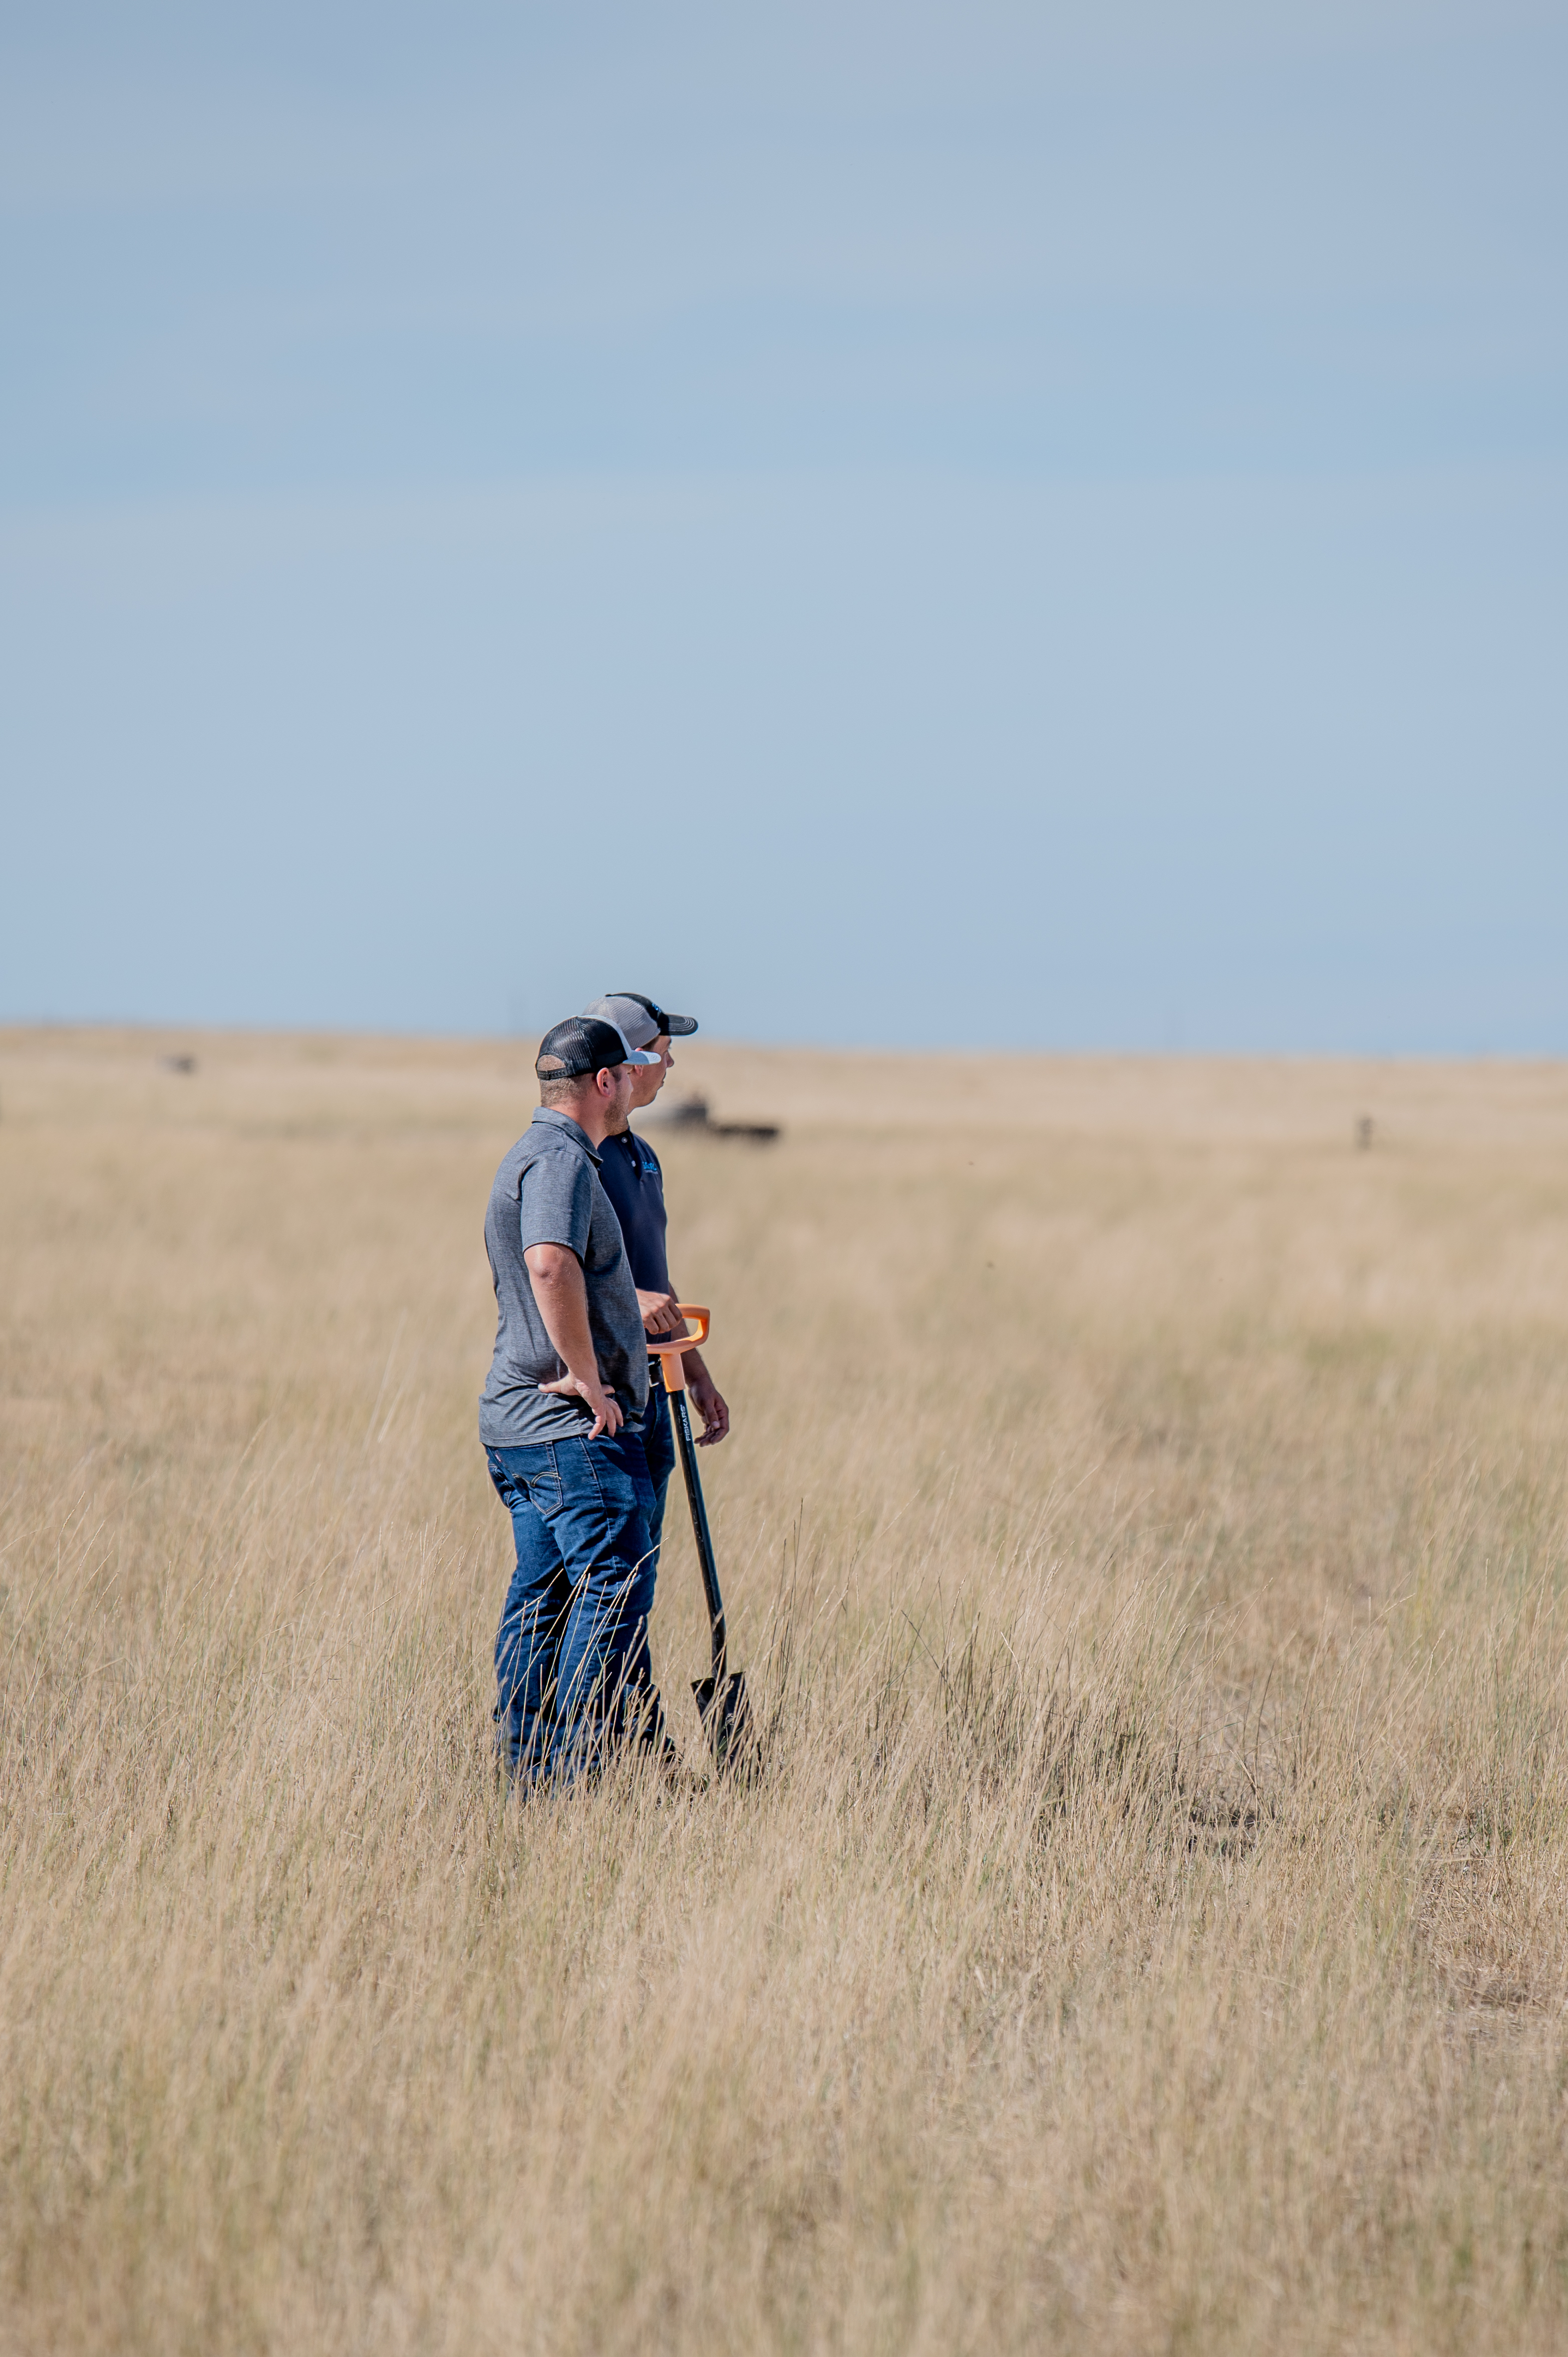
It’s important to remember that no matter what tool you use to better understand your land, nothing beats boots on the ground. Photo points, line transects, clipping, and weighing forages in hoop frames – it can have its place. For example, I’m going to share a tool below that can give us very comprehensive data to calculate stocking rates. The caveat is that it can’t tell the difference between desirable forages and noxious weeds. The satellite’s measurements that it relies on are impacted by harvesting crops, cloud cover, etc. So use it all with caution and your own ground truthing. The most powerful knowledge is going to come when combining good monitoring data with the local knowledge of what has happened in the management. Nothing will tell you more about your grazing impact than actually looking at your pastures and livestock regularly. One of the ways we can listen to the land is by observing the patterns in plant species occurrence we see.
There is this idea of seral succession in landscapes, basically, the geological and ecological process of time that changes bare rock, into soil, early plant colonizers, then more complex grasslands, shrublands and forests. How this appears across the country is not linear and definitive but rather a complex patchwork of areas that are in different stages of this ecological succession. The driving force that moves systems forward in this gradient is the biological processes in the soil. The force that reverts systems to early stages is a disturbance, usually in the form of grazing, fire, or erosion. So when the trained eye sees plant community population dynamics at play, we can make some guesses about how the underlying conditions and past management have influenced the abundance or absence of a particular species or group of plant types.
In the context of grazing in a rangeland setting, you can see this by trying to identify key indicator species called “increaser,”“decreaser,” or “invader” plant types. This categorization is based on the plant’s response to grazing impacts. Increasers (yellow light), like prickly pear and blue grama, become more abundant over time when the grazing regime causes too much disturbance. Decreasers (green light), like bluebunch wheatgrass or basin wildrye tend to decrease with mounting grazing pressure. Invaders (red light) are often tenacious perennial plants that grow weedy and unchecked by competition or disturbance. So, in evaluating the historical grazing pressure in a rangeland pasture, identifying where plants appear on the spectrum – from disturbed mineral soil to the local climax plant community- can tell us a lot about the conditions and management that the ground has seen. The technology we have nowadays, while incredible, can’t tell us that part of the story yet so make sure to observe your pastures regularly, and maybe spend some time walking around with plant nerd people like me who blurt out the names of each species like it’s a tick they can’t shut off.
It All Starts With A Shapefile
When you’re managing land and need to make decisions, often these conversations are best started with a map. It may seem simple, but making a map of your farm, ranch, field, pasture, or project area could be daunting if you don’t know where to start. I have always found a great partner in my local NRCS office, and I always encourage folks to see if they can get some technical assistance in creating digital shapefiles and printing off physical maps. If you have previously worked with any USDA programs, your local office likely already has them on file. When producers are being onboarded into our carbon program, our Data Specialists’ first order of business is to create shapefiles for all the fields and pastures on your farm or ranch. Onyx Hunt, Google Earth, and state tax Id/parcel databases like the Montana Cadastral can all be quite useful in this process too. A zipped digital shapefile folder will allow you to upload your specific geospatial location into some incredibly sophisticated (and free!) remote sensing platforms that can give you extensive information about your soil, water, and vegetation resources. I am going to give a little background and some overly simplistic steps below to help you access these features. New technology can easily be overwhelming, so reach out to me or another trusted advisor for a thorough tutorial.
Web Soil Survey
The first digital landscape assessment tool I was ever introduced to is the widely known service run by NRCS, which provides access to a massive collection of natural resource information for more than 95% of the nation’s counties. It’s a little clunky, but with some patience, you can find more things than you probably ever care to know about the estimated foundational properties of your soil and what that means for land management.
- Upload your shapefile or draw your own Area of Interest, which you can then export as a handy shapefile.
- Click through the tabs on the top to look at the soil map and explore soil data.
- Run your desired reports and then add them to your shopping cart. Don’t worry—this tool and all the others I’ll describe are free and open-source.
Rangelands Analysis Platform
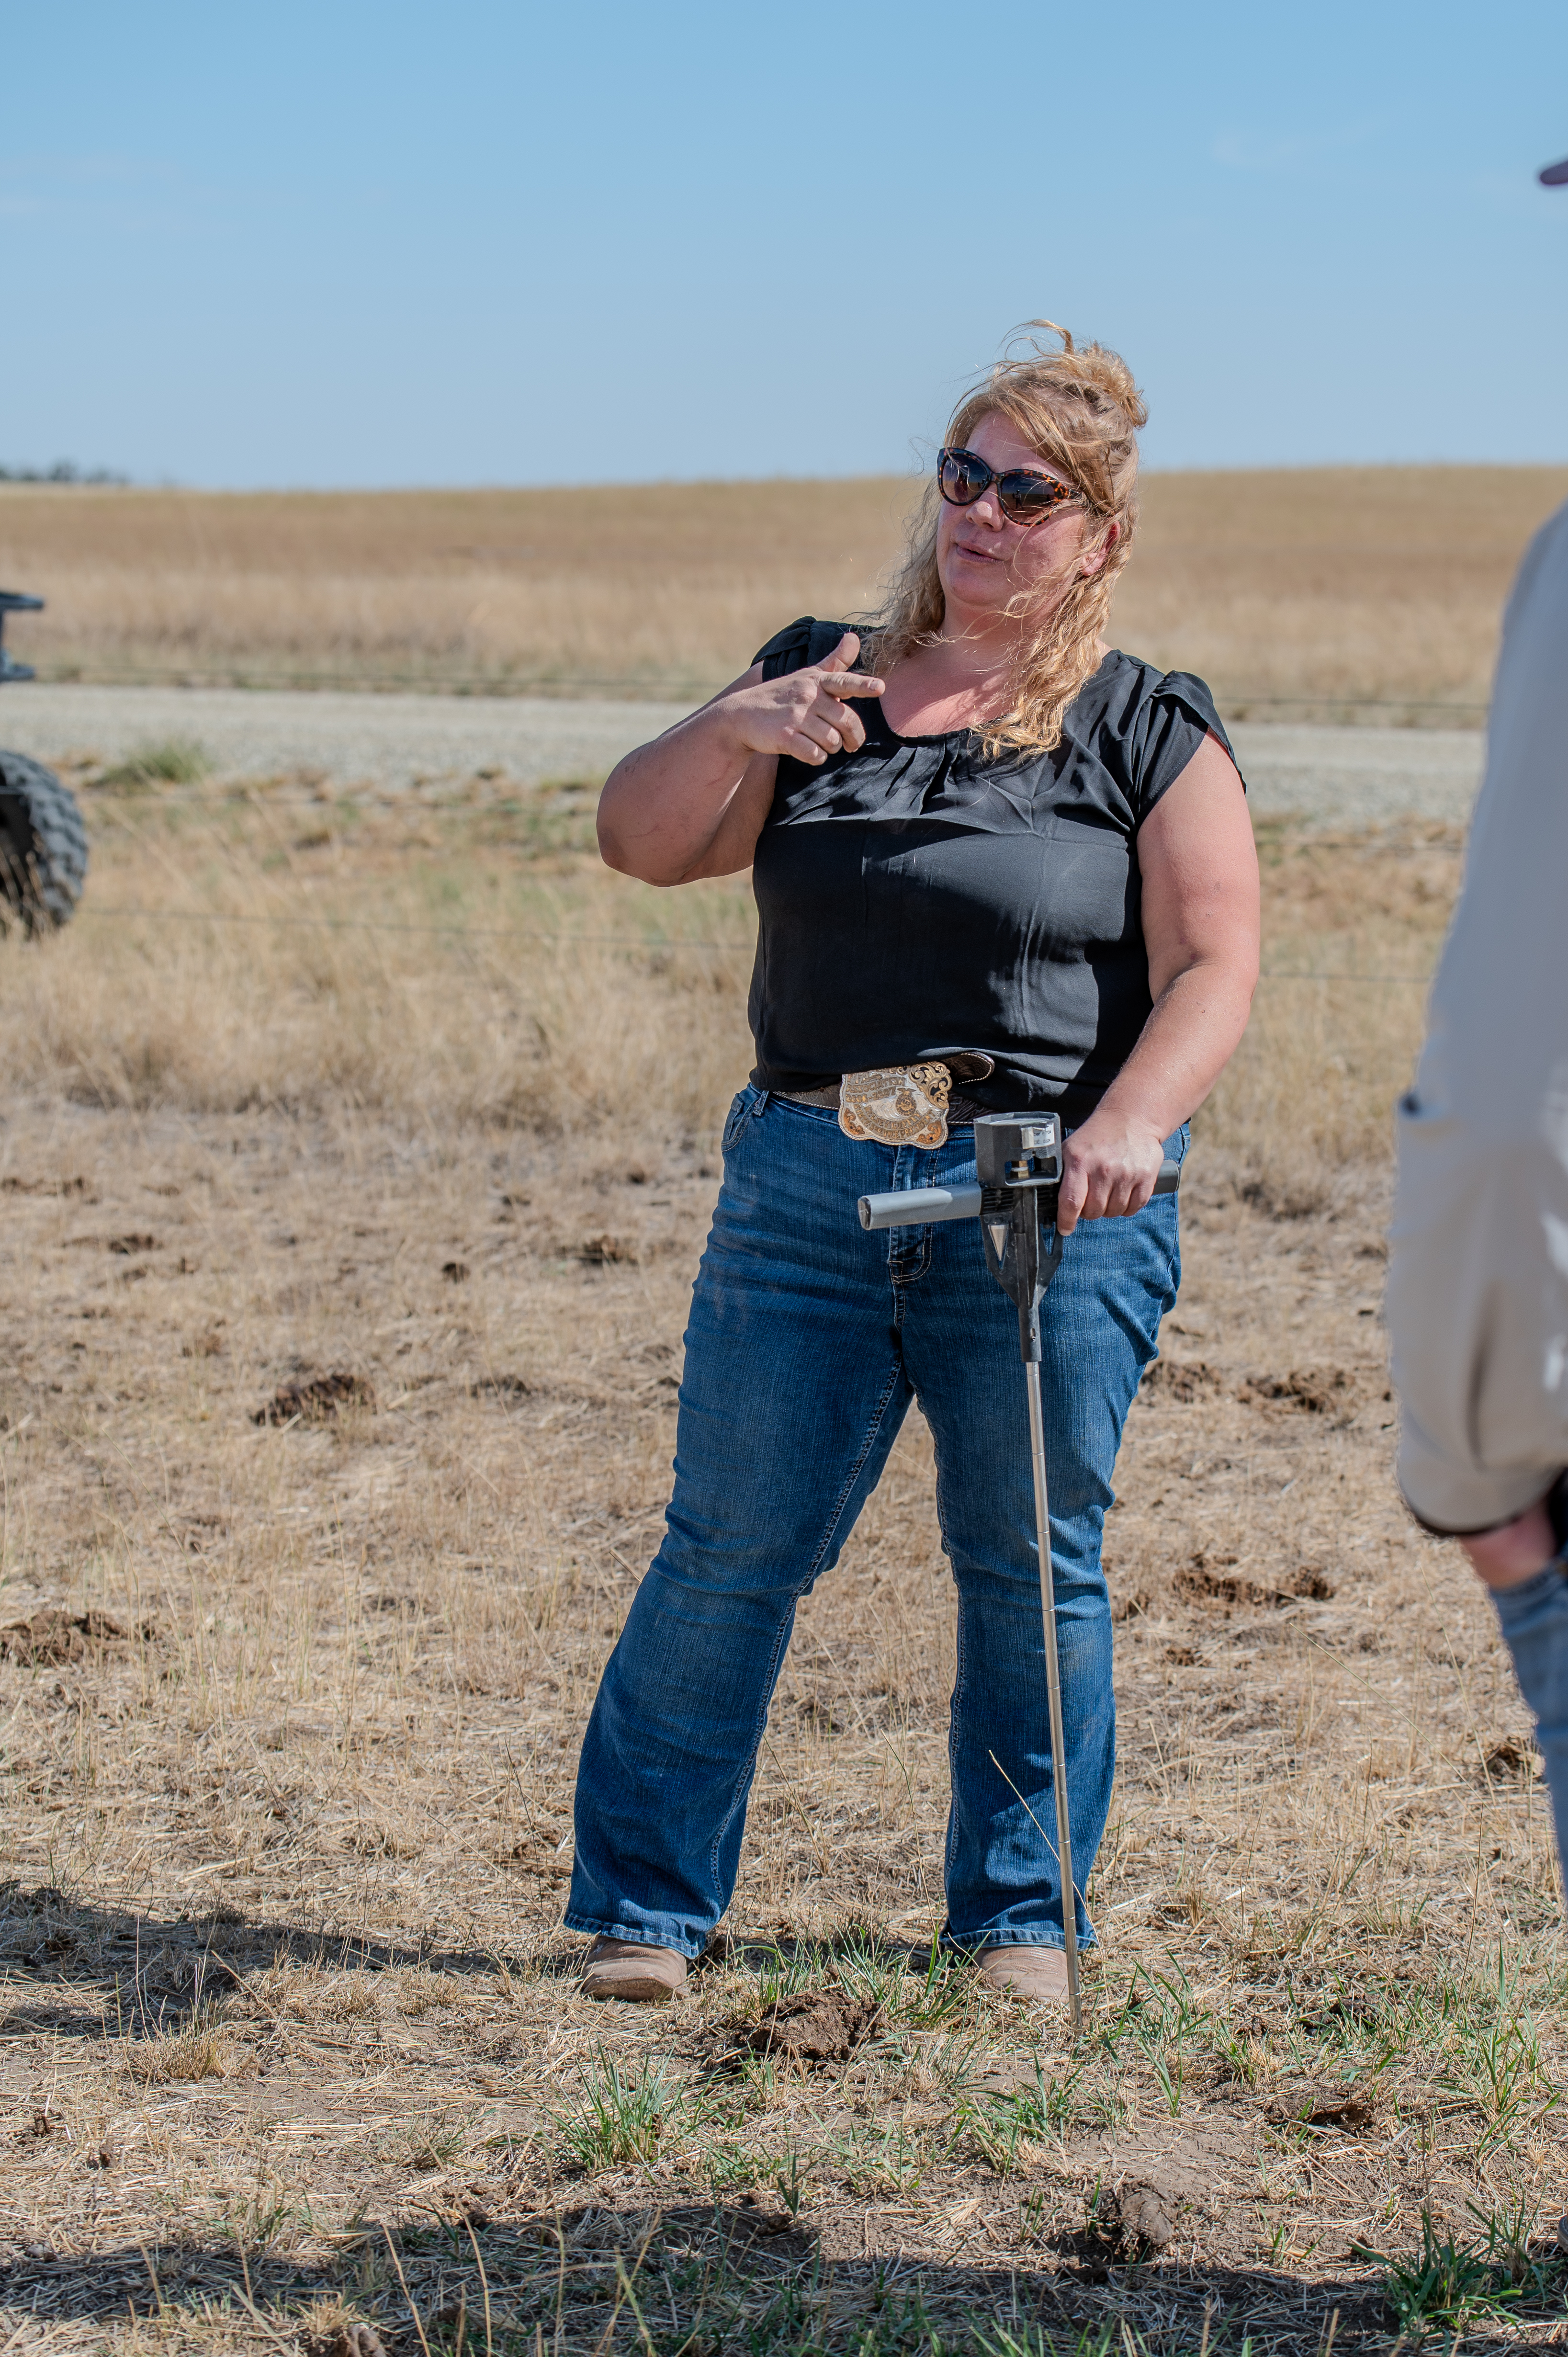
This tool really revolutionized my career in grazing and range management. It was initially developed by University of Montana professor Brady Alred, PhD. I met Brady when he was interviewing for his research fellowship in Missoula, because his hiring committee came to the National Bison Range, where I was working for the U.S. Fish and Wildlife Service. I drove them all around in my white government-issue pickup as we talked about the grazing management and monitoring we were doing. The NBR has dozens of long-term permanent transects and grazing exclosures – and I was the gal whose job it was to manually collect all that data, to add to the massive file cabinet containing dusty records all the way back to the 1940’s in some cases.
Dr. Alred and his team sensed my passion and scientific frustration, and kindly asked me later if I would join his research team in traveling the country to dig soil pits and collect vegetation monitoring data (collectively now at over 250,000 sites) to ground truth this satellite data. They were going to analyze it all the way back to 1986 to produce reporting of vegetation cover and biomass production across the entire landscape at the touch of a button. My mind was blown, and I was very intrigued, but as fate would have it I soon found out that I was expecting my first baby, so I decided to keep laying down my own roots in Montana. Coming full circle, the RAP tool launched right about the time I was ready to get back to work. Then I was consulting for integrated noxious weed management projects and adaptive grazing education across nearly a million acres of production agriculture and public land. I was still just one gal in a white government-issue truck, though. I needed this tool, we all needed this tool!
- Use the RAP tool to upload your shapefile or draw any area larger than a baseball diamond (30m x 30m). I find changing the basemap to the satellite imagery helps orient you better.
- Toggle on the heat maps, where the darker color values on the map represent greater % cover of different plant functional groups or greater biomass from plant growth.
- Click on one of your polygons on the map and select Calculate time series. Soon you will see three reports you can then enlarge, save, or print them.
- On the first Cover tab, you’ll see trends in precipitation, perennial grasses/forbs, annual grasses/forbs, trees, shrubs, and bare ground.
- Switch to Annual Biomass, and you will see pounds per acre of annuals, perennials, and the total herbaceous biomass from grasses and forbs.
- The last report, 16-day Biomass, shows the rate of growth through the season for each individual year.

Production Explorer
We can use this kind of data to evaluate soil health and provide adaptive stocking rates. RAP is now serviced through the USDA and Working Lands for Wildlife. They also took this production data and created a super easy-to-use stocking rate calculator. The process is similar to the steps above.
- Import your data by uploading a shapefile or drawing a feature.
- Select one of your polygons on the map and click Calculate time series Soon, you will see a text box pop up saying Congratulations, your data is ready.
- Now you can click through the report tabs at the top to look at the current year production, and historical production, or to generate a stocking rate estimate for the projected amount of forage production.
VegScape – Vegetation Condition Explorer
This platform from the National Agricultural Statistics Service requires a bit more technical knowledge but gives you great “redlight/greenlight” reporting about vegetation production. The same remote sensing data that RAP uses, called NDVI or the Normalised Difference Vegetation Index, is available here, as are other reports like VCI or the Vegetation Condition Index, which compares year-over-year differences in production.
Crop-CASMA (Crop Condition and Soil Moisture Analytics)
Thanks to NASA, we have this tool as well, import your shapefiles or zoom in on your area to see where soil moisture levels are in relation to historical averages for any date you select.
Wetland Evaluation Tool (WET)
From the Intermountain West Joint Venture comes to us this tool with a Resilience, Hydroperiod, and Surface Water module to investigate trends in the hydrology for wetlands.
Cropland CROS
If you are interested in knowing the cropping history of a field, find your area of interest and click through the years of historic data on crop type and fallow years. This method uses similar remote sensing data and calibrated it with FSA crop reporting.
Monitoring For Informed Management
This list is just scratching the surface, it’s hard to keep up with the pace of new stuff coming out, even when this is the kind of thing I get to do every day. I’m so passionate about sharing these advancements on support visits, to our online community, and to the wide web of passionate people like you reading this article and stewarding working lands.
I believe these kinds of tools fill a treacherous void of scientifically backed decision-making for our industry. We can finally provide quality feedback about land resource conditions and management practices. Putting this data in the hands of people who actually make decisions on the land really quickens that learning feedback loop that is so essential to good, adaptive, holistic management. Knowledge is power, and it belongs to the people. This gives producers tangible evidence to help communicate their story. It’s a story that deserves to be told, to the consumer, to the banker, insurance agency, the government office, grant application, leasee, lessor, family member, neighbor, board member, or any other stakeholder in your operation. A lot of this big data is stuff that sometimes individual managers already know, either anecdotally or intrinsically. It’s other people that we might need to illustrate that authentic story to.
This is precisely what we need to cultivate resilience for agriculture and the rural communities that depend on it. You won’t find me trading dogma for dollars, as well-intentioned conservationists often have. We don’t have all the answers, never have, and never will. There is no one right path in an ever-changing world, no best management practice, no prescription anyone can write you to best manage your farm or ranch. There is only constant personal learning and real life doing to be done, luckily, that’s what ag producers do best. So please, lean on your resources, do safe-to-fail experimentation, and get some quick and dirty answers about your effectiveness from these cool new tools.
