Introduction
High-quality carbon credits begin with high-quality measurements.
Soil Organic Carbon (SOC) originally comes from atmospheric carbon dioxide (CO2) that is captured by plants through the process of photosynthesis and stored as Soil Organic Matter (SOM). Soil Organic Matter is roughly 58% SOC and includes all that is of biological origin contained in the soil matrix, irrespective of origin or state of decomposition. In agricultural soils, SOC content is usually less than 5% of the soil mass and decreases with soil depth. Per Verra methodology VM0042 (the methodology Agoro uses in its projects), carbon project owners are required to report the change of SOC, along with methane (CH4) and nitrous oxide (N2O) in tonnes of carbon dioxide (CO2) equivalent per unit area per monitoring period during the project year.
Agoro uses a variety of data sources and tools to accurately and cost-effectively estimate and report changes in greenhouse gases to satisfy the guidance provided by Verra’s VM0042 methodology. As an example, Agoro Carbon has built one of the most rigorous soil sampling and measurement systems in the market, providing the scientific foundation needed to quantify carbon with confidence and at scale. To date, Agoro Carbon has collected more than 110,000 soil samples, across 34 states and 2.6 million enrolled acres in the US. Over 90% of the collected and tested samples have also been retained for further analysis and validation by Agoro, creating a valuable physical sample archive that complements our extensive digital dataset. Together, these physical and digital assets provide a unique foundation for ongoing validation, analysis, and improvement of our soil carbon measurement system.
Our standard soil sampling protocol measures SOC to 30-cm, consistent with the minimum depth recommended by Intergovernmental Panel on Climate Change (IPCC) and Verra for SOC quantification. Recognizing the importance of understanding carbon beyond this depth, Agoro Carbon also conducted a one-meter soil sampling campaign to characterize SOC distribution throughout the soil profile and strengthen our understanding of deeper soil carbon dynamics.
Why sample to one meter when most carbon is in the top 30 cm?
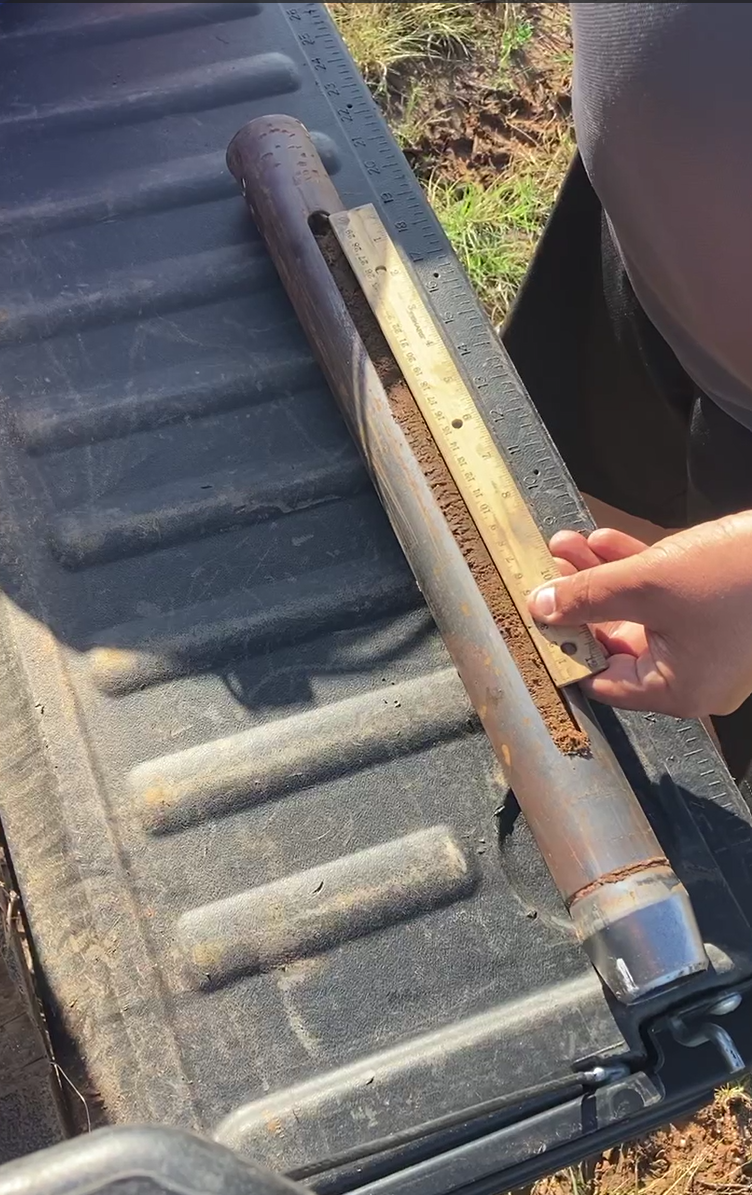
In many cropland and rangeland systems, the top 30 cm of soil represents a zone of high biological activity; carbon inputs, water uptake, and nutrient cycling occur. Plant roots are often concentrated in this layer, making it an important interface for plant-derived carbon inputs and soil processes. In drier, lower-productivity environments, this zone of greatest biological activity can be considerably shallower, sometimes extending less than 10 cm into the soil profile (Hoyle et al., 2013).
There is scientific debate about how agricultural practices such as no-till influence the redistribution of carbon within the soil profile, including whether management practices promote carbon accumulation at depth or redistribute existing carbon between soil layers. More broadly, the effects of agricultural management on subsoil carbon remain incomplete (VandenBygaart et al., 2011, Ogle et al., 2019 and Button et al., 2022).
Measuring and modeling SOC to 30 cm is a well-established and standardized approach that enables comparisons across regions and has been used in soil carbon research and protocols for decades. However, understanding carbon dynamics below 30 cm can further strengthen our scientific understanding of soil carbon sequestration and flow among different layers. To better understand the SOC distribution beyond the standard 30 cm depth and address remaining uncertainties, Agoro Carbon conducted a one-meter soil sampling campaign focused on two questions:
- How do SOC stocks change throughout the soil profile from the surface to one meter?
- How do agricultural management practices influence SOC stocks at deeper soil depths?
Learnings from deeper soil sampling campaign and inter-laboratory comparison
Our commitment to measurement quality extends beyond field sampling. Our rigorous quality control and improved laboratory standard operating procedures (SOP) have produced an exceptional 0.997 inter-laboratory correlation for SOC measurements, providing strong evidence of analytical consistency and confidence in our underlying data.
This level of measurement rigor is particularly important because the amount of sequestered soil carbon is inherently variable. Field heterogeneity, differences in soil depth and properties, and laboratory analytical variation can all affect the ability to detect relatively small changes in SOC.
Our one-meter sampling campaign further demonstrated several important insights:
- Robust controls matter: Establishing suitable control fields within working agricultural landscapes is challenging, reinforcing the importance of rigorous field selection and experimental design.
- Measurement consistency is high: Results from the two participating laboratories were highly correlated, supporting confidence in Agoro Carbon’s laboratory processes and sampling methodology.
- The upper soil profile is critical: A substantial proportion of SOC was concentrated within the top 30 cm, reinforcing the importance of this depth for soil carbon quantification.
- Deeper carbon requires time and rigorous monitoring: No significant SOC differences associated with practice change were detected in the deeper profile, consistent with the relatively short implementation periods and limited management contrasts evaluated.
Why does this matter for carbon credit buyers?
This rigorous sampling approach underscores why consistent sampling, robust quality control, and reliable laboratory analysis are essential to credit integrity.
Sampling design: measuring a highly variable landscape
To evaluate soil carbon across a range of real-world agricultural conditions, Agoro Carbon selected four growers representing a range of practices, geographies, and cropping systems. Each site underwent stratified random sampling design, field sampling, lab SOC analysis, and final data analysis and reporting.
Row crop system with reduced tillage and cover cropping.
Rangeland cow-calf production system with improved grazing and fertilization.
Rangeland cow-calf production system with seeding and fertilization.
Row crop system with reduced tillage and cover cropping.
SOC can vary substantially over short distances due to differences in soil texture, slope, drainage, vegetation, past management, erosion, and water movement. Agoro Carbon therefore uses stratified random sampling, dividing fields into relatively uniform zones based on multiple soil, landscape, remote-sensing, and climate variables. This approach reduces sampling variability and uncertainty while improving the efficiency of soil carbon stock estimates.
The campaign used a paired-field approach, comparing treatment fields with nearby control fields selected for similar soil, terrain, and climate conditions. These controls were not true for experimental controls established before management changes; rather, they served as practical comparisons within working agricultural landscapes. Fields were sampled in fall 2025, approximately one to four years after implementation of new practices.
Field conditions also limited sampling at some sites. Shallow, rocky soils in Oregon prevented sampling beyond 30 cm, while frozen soils prevented sampling at the Minnesota site.
Results
Soil Organic Carbon Distribution and Management Practice Effects
As indicated in Fig 1, Soil organic carbon was concentrated near the soil surface. At sites successfully sampled to one meter, the top 30 cm represented only 30% of the sampled depth but contained, on average, 49% of total SOC stock, highlighting the importance of the surface enrichment zone.
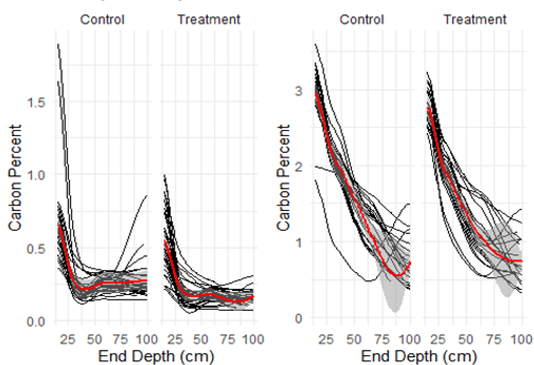
Clear management-driven differences in SOC were not detected under the specific management histories, timeframes, and field conditions evaluated. This likely reflects limited management contrasts and the relatively short time since practices were implemented, rather than evidence that the practices have no effect on SOC.
The Iowa cropland example illustrates this challenge: both treatment and control fields used reduced tillage, with the main difference being approximately one year of cover cropping. Differences in crop rotation, including greater corn silage production in the treatment field, may also have influenced carbon inputs.
Rangeland results similarly showed that SOC is strongly influenced by plant communities, root growth, grazing intensity, rainfall, soil texture, and landscape position. Longer monitoring periods and stronger management contrasts will likely be needed to detect meaningful changes in SOC.
Laboratory Comparison
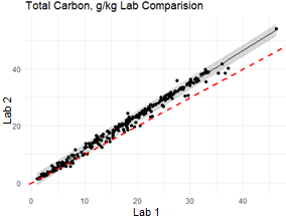
To assess analytical consistency, soil samples from the 0-15 cm and 15-30 cm depths were independently processed and analyzed by two lab partners. The results were very strongly correlated, with an R-squared value of 0.997 (Fig. 2).
An R² of 0.997 indicates that the two laboratories produced highly consistent results across the samples analyzed, providing strong evidence of analytical reproducibility. This result reinforces the importance of standardized laboratory SOPs, consistent sample handling, and rigorous quality control in producing reliable soil carbon measurements.
For carbon credit buyers:
This level of inter-laboratory consistency provides additional confidence that differences observed in SOC measurements are more likely to reflect real differences in soil conditions rather than analytical variation.
Conclusion
The campaign demonstrated that one-meter soil sampling provides valuable insights into the vertical distribution of SOC and confirmed that a substantial proportion of SOC is concentrated within the top 30 cm. Deeper sampling was feasible in many agricultural soils, although shallow or rocky conditions can limit access.
The strong inter-laboratory correlation (R² = 0.997) provides additional confidence in the consistency and reproducibility of the dataset and reinforces the importance of rigorous sampling, standardized laboratory procedures, and quality control.
What’s Next
Detecting and attributing meaningful changes in SOC requires time, repeated measurements, appropriate sampling depth, and robust experimental design. Agoro Carbon will continue to strengthen its measurement science by expanding grower participation, extending monitoring periods, and improving management contrasts and control designs.
These efforts will further strengthen the scientific foundation and confidence in the integrity of Agoro Carbon’s soil carbon credits.
References (4)
Button, E. S., Pett-Ridge, J., Murphy, D. V., Kuzyakov, Y., Chadwick, D. R., & Jones, D. L. (2022). Deep-C storage: Biological, chemical and physical strategies to enhance carbon stocks in agricultural subsoils. Soil Biology and Biochemistry, 170, 108697.
Hoyle, F. C., D’Antuono, M., Overheu, T., & Murphy, D. V. (2013). Capacity for increasing soil organic carbon stocks in dryland agricultural systems. Soil Research, 51(8), 657–667.
Ogle, S. M., Alsaker, C., Baldock, J., Bernoux, M., Breidt, F. J., McConkey, B., Regina, K., & Vazquez-Amabile, G. G. (2019). Climate and soil characteristics determine where no-till management can store carbon in soils and mitigate greenhouse gas emissions. Scientific Reports, 9, 11665.
VandenBygaart, A. J., Bremer, E., McConkey, B. G., Ellert, B. H., Janzen, H. H., Angers, D. A., Carter, M. R., Drury, C. F., Lafond, G. P., & McKenzie, R. H. (2011). Impact of sampling depth on differences in soil carbon stocks in long-term agroecosystem experiments. Soil Science Society of America Journal, 75(1), 226–234.
White paper
Get the full white paper
Methods, figures and references from Agoro Carbon’s one-meter sampling campaign, in a printable PDF.
View / Download PDF